Last week at the MET in Sydenham involved a lot of information relating to camera/recordings suitable for CCTV evidence in court. Part of this involves resolution and how that gets faithfully reproduced.
The standard resolution chart pre-HD was the EIA 1956 chart;

Pointing a camera at this so that it fills the frame (yes, it's 4x3!) you then have graded scales of resolution. The idea is that if you had alternating white/black stripes how many could you have horizontally across the frame and still resolve the stripes? In the case of a good SD camera->monitor about 500 lines of TV resolution are possible. In HD it's 1,500 at best.
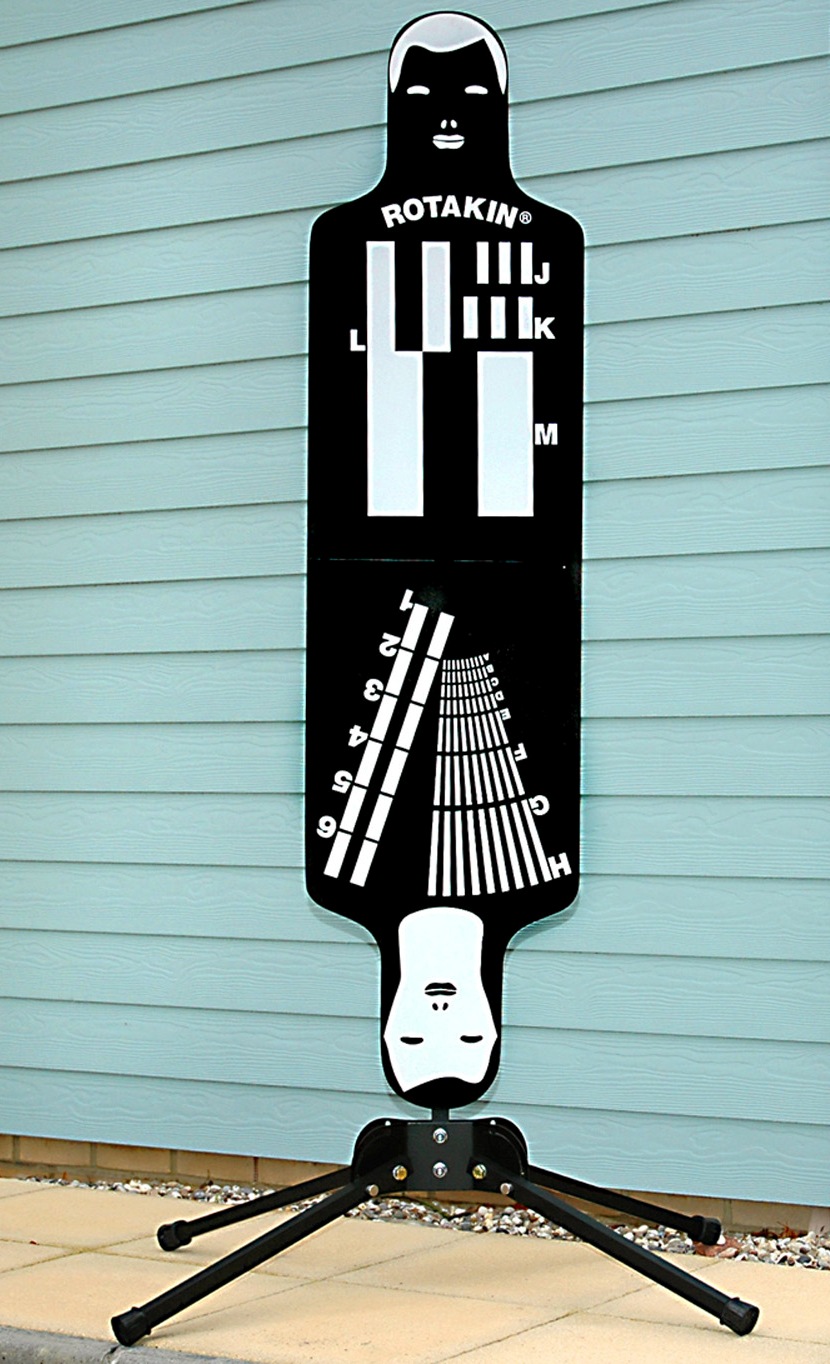
The security industry has its own testing standard. The Rotakin target was developed by HOSDB (Home Office Scientific Development Branch) as a means of auditing the efficiency of a CCTV system. It consists of a human silhouette target 1.6m in height. When the target fills the screen vertically it is said to be 100%R.
The target has various gratings for ensuring the modulation transfer function of the system allows footage to have the required resolution so that video material will stand up in court.
As well as lens, sensor, encoding/compression system the other factor that will affect how well each resolution grating is reproduced is lighting.
The requirement for identification is that the subject more than fills the frame (i.e. 120% R).At 100% R the A-grating should be discernible which implies the system has 500TVL resolution.

